By Dana P Skopal, PhD
In many disciplines, writers need to be able to explain their data to their readers, but often are not aware that they need to explain the data in two formats. As readers’ approaches to understanding figures and charts vary, in our workshops we emphasis the importance to present key data in both a visual format and in a short paragraph.
Data can be presented as a table, chart or even in a spreadsheet. These are great for visual readers, who can absorb a great deal from a ‘picture’ format. However, some readers cannot see ‘the wood from the trees’ if looking at a table or chart. Hence, you need to be able to succinctly describe the key results in a paragraph. This paragraph is often called a data commentary.
A data commentary needs to explain to the reader the context for the data, the main figures/results (letting go of the detail) and why these are important for your argument / recommendation. You also need to clearly link it to the figure or table – eg Figure 1 or Table 1, which can be given a title in more formal documents.
When drafting your explanation, ask yourself the following questions and image that you had to respond verbally to your colleague – face to face. First, how can you refer to your data so the reader can understand what it was representing (ie the context)? Next, what important information should be gleaned from the chart (ie key findings)? Finally, can you briefly explain how the data validated your conclusion/recommendation? This way you can focus on the message that you are aiming to relay.
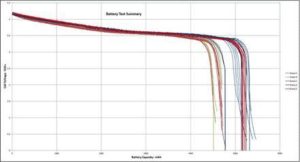
As an example, here is a data commentary describing the following chart.
A quantity of 26650 Li-Ion batteries were sourced from country FGH and tested for inclusion in the design of product BNM for Company XYZ. The batteries were all fully charged using a 4-stage “smart” charger and then discharged using a fixed load resistor. The cell voltages were recorded at regular intervals during the discharge process. The “Battery Test Summary” (see Figure 1) shows the discharge characteristics of the sample batteries, represented as cell voltage vs battery capacity. The chart shows that Brands B and C do not meet the manufacturer’s 5000mAh specification and 50% of Brand D’s samples also fail to meet this target. The variations in performance of the Brand A samples is quite wide and therefore should not be considered appropriate for this project. Brand E batteries are recommended for this project as not only do they exceed the 5000mAh specification, the sample-to-sample consistency of the results is very good.
Copyright © Opal Affinity Pty Ltd 2018

